Der SRREN Report (Special Report on Renewable Energy Sources and Climate Change Mitigation / deutsch: Spezialreport zu Erneuerbaren Energien und Klimaschutz) ist ein 2012 veröffentlichter Report des Intergovernmental Panel on Climate Change (IPCC). Er behandelt die Technologien und die Rolle von Erneuerbaren Energien in Bezug auf das Thema Klimaschutz.
Bei dem IPCC (oft auch „Weltklimarat) handelt es sich um eine vom Umweltprogramm der Vereinten Nationen (UNEP) und der Weltorganisation für Meteorologie (WMO) gegründete Organisation, die unabhängige wissenschaftliche Untersuchungen zum Thema Klimawandel bereitstellt. Mehr als 195 Staaten sind Mitglied im IPCC.
Der SRREN Report gliedert sich grob in drei Kategorien (siehe Grafik):
- Einführung
- Technologien
- Einordnende Themen
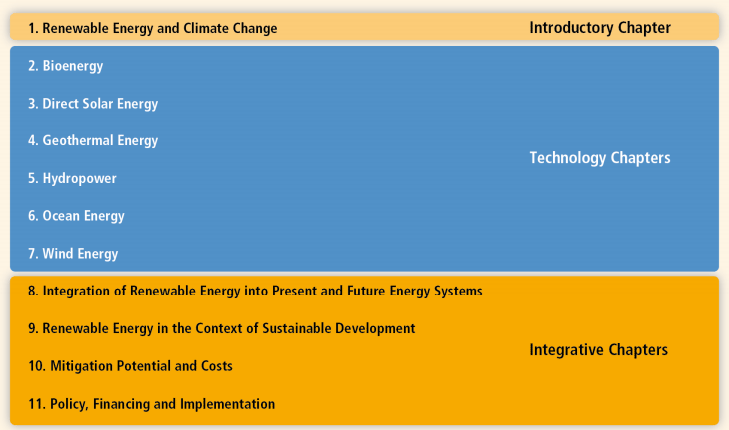
Im Kapitel Technologien werden verschiedene Arten von Erneuerbaren Energien auf Ihre Rolle und Kosten untersucht. Dabei handelt es sich um folgende Energieformen:
- Bioenergie
- Sonnenenergie
- Geothermie
- Wasserkraft
- Meeresenergie
- Windkraft
SREEN Report herunterladen
- Kapitel 1: Erneuerbare Energie und Klimawandel
- Kapitel 2: Bionenergie
- Kapitel 3: Solarenergie
- Kapitel 4: Geothermie
- Kapitel 5: Wasserkraft
- Kapitel 6: Meeresenergie
- Kapitel 7: Windkraft
- Kapitel 8: Einordnung von Erneuerbarer Energie in heutige und zukünftige Energiesysteme
- Kapitel 9: Erneuerbare Energie im Kontext von nachhaltiger Entwicklung
- Kapitel 10: Potential und Kosten
- Kapitel 11: Regulierung, Finanzierung und Implementierung
- Anhang 1: Glossar, Akronyme, Symbole
- Anhang 2: Methoden
- Anhang 3: Kosten und Leistungsparameter
- Anhang 4: Mitwirkende
- Anhang 5: Reviewers
- Anhang 6: Erlaubnis zur Veröffentlichung
- Index
Zitieren
Um den Report zu zitieren, benutzen Sie bitte folgende Angabe:
IPCC, 2011: IPCC Special Report on Renewable Energy Sources and Climate Change Mitigation. Prepared by Working Group III of the Intergovernmental Panel on Climate Change [O. Edenhofer, R. Pichs-Madruga, Y. Sokona, K. Seyboth, P. Matschoss, S. Kadner, T. Zwickel, P. Eickemeier, G. Hansen, S. Schlömer, C. von Stechow (eds)]. Cambridge University Press, Cambridge, United Kingdom and New York, NY, USA, 1075 pp.